Not everyone uses Google Analytics or other 3th party logfile parsers. So a customer asked me to create some reports based on their IIS logfiles. The web is full with examples so one more or less won’t make a difference 🙂
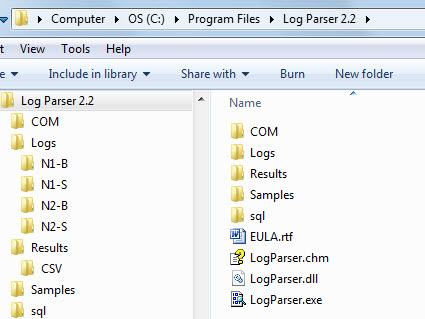
First step is to download Logparser v2.2 and install this on a PC. Doesn’t have to be the server. Default installation path is “C:Program FilesLog Parser 2.2”
Queries can be run from the command line or used via an external .sql-file. I prefer the latter method so I create 3 subfolders: “SQL”, “Logs” & “Results”. I copied the IIS logfiles to subfolders under LOGS.
Mike Lichtenberg has a demo page with 50-examples to give you an idea what’s possible. Below are 2 simple examples that my customer wanted to have.
1. number of hits per day
Customer (internal webservice) has no stats tool so he wanted to know how many hits this WebService received over a period of time. The query is below, I will explain it afterwards. Save this query in a text-file and name it “RequestPerDay.sql”
SELECT QUANTIZE(TO_TIMESTAMP(date, time), 86400) AS Day, COUNT(*) AS Total
FROM Logs%cFolder%u_ex*.log where cs-uri-stem not like '/loadbalancetestpage.html' GROUP BY Day ORDER BY Day
What we do above is convert the date/time to a timestamp and group them by day (86400). If you replace 86400 by 3600 then you would receive stats per hour but the customer wanted to compare 6 months so we would have received too much output. Notice the ‘%cFolder%’ variable, I do this because there are numerous webservices and this way I can easily target a different subfolder. I also exclude a test-page that it is used by the hardware loadbalancer. Running this straight from the command line would be like this, notice how I pass the folder variable!
Logparser file:sqlRequestPerDay.sql?cFolder=N1-B

It works but not very handy so luckily LogParser supports other methods. Like CSV-export, don’t we all love that! Let’s try the command above again with some extra parameters.
Logparser file:sqlRequestPerDay.sql?cFolder=N1-B -stats:off -o:CSV > results/CSV/ReqPerDay.csv

So, nicely formatted and we can now use this data to create graphs in Excel or in any other tool that supports CSV-data.
2. Hits for a specific page
You know now how it works so we skip the blabla and go straight to the query and the output.
SELECT TO_TIMESTAMP(date, time) AS Day, cs-method as Method,
STRCAT( cs-uri-stem,
REPLACE_IF_NOT_NULL(cs-uri-query, STRCAT('?',cs-uri-query))
) AS Request,
STRCAT( TO_STRING(sc-status),
STRCAT( '.',
COALESCE(TO_STRING(sc-substatus), '?' )
)
) AS Status,
time-taken
FROM Logs%cFolder%u_ex*.log where cs-uri-stem like '/Pages/dymmyname.aspx' ORDER BY Day
Above we are grouping the url and also the status. The advantage is that you would see 401.3 instead of just error 401
Logparser file:sqlBO-Pickup.sql?cFolder=N1-B -stats:off -o:CSV > resultscsvBO-Pickup.csv

The possibilitied are endless so go ahead and try some queries on your own!!






Recent Comments